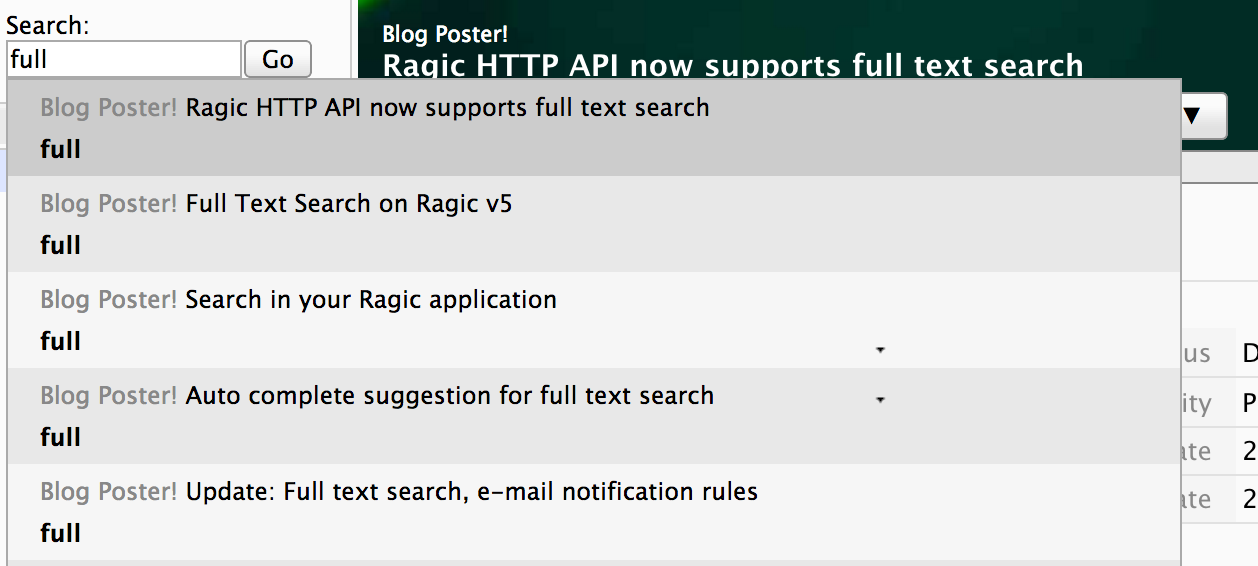
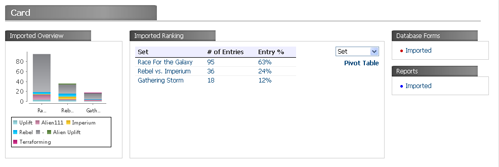
Graphical charts and analytical reports are integral for decision making executives to easily digest all key data and trends to make informed decisions. This is why Ragic has developed automated dashboards that allow you to view data in bar charts, ranking tables, and more.
続きを読む